Spectral Flow Detection
Spectral flow detection is done with two type of markers that detect quick energy variations increase or decrease in the signal.
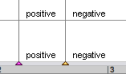
Spectral Flow Markers
| 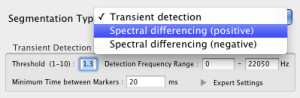 |
To trigger the analysis, press In the upper pop up menu of the dialogue window, choose Markers will be displayed across the waveform and sonogram windows. | 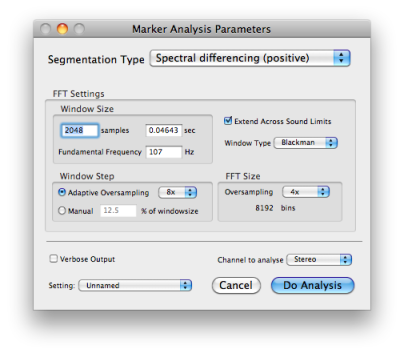 |
As shown by the dialogue window, the accuracy of the analysis entirely depends on the FFT parameters.
Representation, Manipulation and Edition
 |
|
Spectral flow markers can be manipulated like manual markers. The number of displayed markers can be controled after the analysis. They can also be partially edited.
- Introduction
- About this Document
- Introduction
- Installation
- Going Through an AS Session
- The AudioSculpt Environment
- Signal Representation
- Signal Analysis
- Modeling Sounds with Sinusoids
- Signal Manipulation
- Managing Treatments
- Processing Sequencer
- Advanced Use
- Errors and Problems
- Basic Analysis/Synthesis Notions
