Fundamental Frequency Analysis – F0
Principles
In the case of a simple sinusoid, the perceived pitch is related to the fundamental frequency. For instance, the sound wave produced by an oscillator at 220 Hz frequency will be perceived as an A3. Besides, the partials of harmonic sounds have a frequency that is the produce of this fundamental with an integer, resulting in a harmonic series. For instance, with an A3, the fundamental frequency is equal to 220 Hz, and the frequency of the upper partials is (440, 660, 880, 110...) so that we get :
Fn = F0 * n
F0 = Fn - Fn-1.
As a convention in AS, the fundamental frequency is called F0.
The pitch of a sound with several harmonic components is easier to detect then that of a single sinusoid, because the ear also detects the difference between the frequencies of the spectral components. For instance, we may detect an A3 whose frequency is 220 Hz, because we analyse the difference between harmonics #2 (440 Hz, #3 (660 Hz) and #4 (880 Hz) very well, even with a weak fundamental.
This differential frequency influences the spectral pitch, while the frequency of the fundamental itself is connected with the tonal pitch.
But the F0 is not always directly related with the perceived pitch, as in inharmonic sounds. The pitch is detected via the frequency difference between the components of a harmonic sound – spectral pitch – rather than via a possibly weak fundamental frequency itself.
This attraction towards spectral pitch may be really crucial when listening to ambiguous sounds, such as diphonic chant[1], or low instrumental pitches, bells, and so on.
F0 Analysis Methods
Choose the Analysis/Fundamental Frequency menu item. Additionnally to a number of parameters, the dialogue window offers three analysis methods :
Feature Scoring
Energy Histogram
Piched Percussions
These two analysis methods are adapted to harmonic and vocal sounds. The feature scoring analysis has a number of additional parameters which allow a more refined control and an adaptation to a given type of harmonic sound.
The basic principle of both F0 estimators is to find a fundamental frequency that explains the energy present in the spectrum, matching it approximately to a harmonic grid. This coincidence is also called spectral match. A problem is that all subharmonics of the real F0 also explain this energy, or even better, as the real F0. The effect of the sub harmonics has to be countered. Two methods are used :
Both estimators use the evaluation of the smoothness of the amplitudes. Indeed, subharmonics have a low amplitude, which also lowers the smoothness of the sequence. The feature scoring and the energy histogram don't evaluate the smoothness with the same algorithms.
Additionnally, the feature scoring estimator also allows to control the impact of the envelope smoothness and spectral match. Indeed, in the case of some instrumental sounds, smoothness is not always as characteristic as for other sounds.
Another criterium is therefore needed to balance the first that could be called spectral match for the feature scoring method. Both estimators try to evaluate the smoothness of the harmonic amplitude sequence to counter the sub harmonic effect. For subharmonics every other harmonic should have low amplitude which makes the amplitude sequence much less smooth then the sequence obtained for the real F0. Both estimators use slightly different algorithms to measure the smoothness.
These analysis method is derived from transient detection analysis. It is mostly adapted to pitched idiophones.
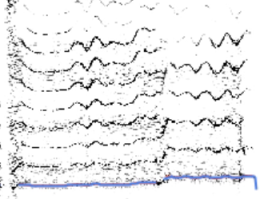
Here is an illustration of the degree of precision that can be reached with basic parametering. We have chitted a little : as the F0 cannot be listened to, we have executed the F0 analysis first, then a partial tracking with a single partial – which is identical to the actual F0 – and synthesized the result with the Synthesize Partials command, which can be compared to a preview.
To get more precise examples and more details about the analysis parameters and , refer the next sections.
- Diphonic Chant
The formants of the voice, resulting from the resonances of the vocal apparatus, are expressed as gains of energy in the spectrum : they will prevail on the fundamental frequency resulting from the vocal folds periodic closing and opening.
- Introduction
- About this Document
- Introduction
- Installation
- Going Through an AS Session
- The AudioSculpt Environment
- Signal Representation
- Signal Analysis
- Signal Analysis Introduction
- Dialogue Window
- Sonogram Analysis
- Spectral Envelope Analysis
- Markers
- Fundamental Frequency Analysis – F0
- Voiced/Unvoiced Analysis
- Analysis Files
- Modeling Sounds with Sinusoids
- Signal Manipulation
- Managing Treatments
- Processing Sequencer
- Advanced Use
- Errors and Problems
- Basic Analysis/Synthesis Notions
