Voiced/Unvoiced Analysis
Principles
The VUV analysis is designed to estimate a cut-off frequency for voiced and unvoiced part of a signal, in analogy with the production mode of vocal sounds.
In vocal sounds, a region of the signal is considered unvoiced when it doesn't result from the vocal fold action, which produce a quasi periodic vibration. Unvoiced sounds can be produced by the lips, the tung, or glottis constrictions... The signal resulting from the vocal folds can be described as a sum of sinusoids. The detection of noise in non vocal sounds can be applied from the analogy with this production mode.
Only a small amount of the spectrum of unvoiced bands should be related to sinusoidal peaks. The frequency estimation is more robust if the proportion of sinusoids is not measured in terms of energy, but regarding the area occupied in the amplitude spectrum.
Accordingly, frequency bands are classified as unvoiced whenever this area – estimated in relation with the normalized energy of the peaks in the whole band – is located below a threshold. The range of this threshold is adjusted to take errors in this classification into account.
Voiced/unvoiced analysis has been added to the AS analysis to
verify the results of the internal processing in the waveform preservation mode
be able to correct errors of the internal voice/unvoiced estimator as you do for F0,
use the result as a basis for further treatments - you will then be able to use the voiced/unvoiced frequency band limit to create filters or other treatments.
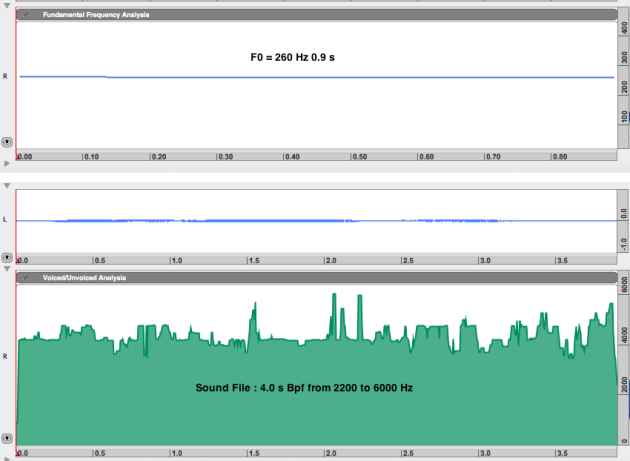
The resulting voiced and unvoiced parts are delineated with a breakfpoint function.
below the BPF is located the voiced part – with sinusoidal content
above the BPF is located the unvoiced part – with noise
Note, that sinusoidal detection is performed differently in the first cutoff frequency analysis band. Speech signals often have a sinusoid with a rather weak fundamental. The first band is then classified as sinusoidal if it contains at least one sinusoid and if the amplitude of this sinusoid is at least -20dB below the frames maximum amplitude.
The VUV analysis is accessed via the Analysis/Voiced/Unvoiced Analysis menu.
Main Analysis Parameters
A relative sinusoidal energy required to define a frequency band as a voiced component. By default, the threshold is set to 30%. This value is that of the threshold ramp start.
An error level expressed as a percentage, to classify a peak as voiced or unvoiced. Classification of peaks in noise is a random process that will fail according to this error level. If this level is equa to 10%, then 10% of the noise peaks are wrongly classified as sinusoidal, which may lead to wrong estimation of the cutoff frequency.
With a high tolerance degree, a sinusoid is more easily classified as a voiced component.
Number of bins per spectral bands used to detect voiced/unvoiced frequency regions. The bandwidth is that of the mainlobe – part with maximum energy– of a stationary sinusoid. A large bandwidth improves the statistical validity of the classification but reduces its sensitivity.
Control frequency limits of the dynamic sinusoidal energy threshold
Voiced bands are more likely in low frequency regions. The cutoff frequency estimation is more robust if the relative sinudoidal energy thresholdincreases with the frequency. The voiced/unvoiced classification is then more biased towards unvoiced regions.
Threshold Ramp Start : frequency corresponding to the voiced/unvoiced band threshold relative sinusoidal energy.
Maximum Voiced Frequency : above this, value the detection of voiced bands is disabled.
The relative sinudoidal energy threshold linearly increases from the ramp start value to 100%, for intermediate frequencies.
To increase the voiced components frequency range, you can either
lower the threshold value
increase the threshold ramp start
increase the maximum voiced frequency.
Check this option to use an F0 analysis as a cutoff frequency. See next part.
Choose this option to apply the analysis to a selected segment. You can specify the beginning and the end of the segment in the corresponding prompts, or select the region manually from the AS window. If a region has been selected, its temporal limits are automatically displayed as selection parameters.
Using an F0 File for a VUV Analysis
The use of a prior F0 analysis can improve the results of the VUV analysis. Having a sinusoidal peak at a very high frequency is very unlikely and at the same time may result in catastrophic cutoff frequency estimates that are very disturbing. Introduction of prior knowledge about the likely location of the VUF helps to avoid this type of errors.
On the other hand
Indeed, the VUV analysis can be performed with the F0 of the corresponding file, or with another F0.
Select the
|
Note that any F0 can be used for the analysis. If the F0 doesn't have the same duration as the analysed file, it will be stretched or compressed.