Visualizing and Editing Markers Values
Parameters
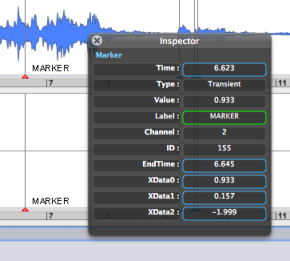
When a marker is selected, the inspector window displays a number of information, with parametric values. | 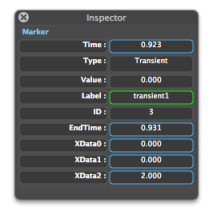 |
These parametric values deal with the markers type, location, label, and value. Among these, the location and label only can be edited.
Location : time, expressed in seconds.
To modify the location of a marker, enter a new value in the prompt.
Label : this prompt is empy until the marker is given a name.
Value : value yielded by the analysis. Manual markers only have a default value, which is equal to 1.000, which is not significant. Value also stands for XData for the spectral flow markers.
Type : analysis type of the markers. The "chord-sequence" value of region markers refers to one of the main use of region markers, the chord-sequence analysis.
Region markers :
- ID : sequential number of the marker since the first region marker has been added in the file. Cannot be edited
Analysis markers
- Time : first time the new event is detectable
- End Time : time when the transient is considered finished, position when the new component (note, noise) is stable.
- XData – transients : the two values represent the relative energy and relative amplitude. XData 1 is the relative energy : amount of the instantanous energy at the transient end, comparatively to the onset. Xdata 1 is small if there is one onset within an ensemble of stationary notes. Xdata 2 is the relative amplitude : maximimum amplitude of the transient component.
- XData – spectral flow markers :
- Xdata 1 is the relative amplitude difference summed over all increasing or decreasing bins using the flow segment (currently always 10 frames). The first 5 frames represent past frames and the next 5 frames future frames. The amplitude is summed of the two segments for all bins and then bin differences are summed for either increasing or decreasing amplitude sums. The difference is normalized by means of the sum of the future (positive flow) or past (neg flow) sums. Xdata 1 is displayed as Value in the inspector. It is always bounded between 0 and 1.
- Xdata 2 is the flow direction (1 for positive flow, -1 for negative flow)
Parametric Values Edition
Values that can be edited are displayed in blue or green prompts. They mostly deal with the markers temporal position and label. Grey prompts are not editable.
Select a marker
Enter a value in the prompt and press
Returnor click somewhere outside the prompt to validate.You may need to click in the window to refresh the display.
 | The label will be displayed in each channel of the waveform and sonogram window. If two markers are quite close to each other, the label will disappear. |
- Introduction
- About this Document
- Introduction
- Installation
- Going Through an AS Session
- The AudioSculpt Environment
- Signal Representation
- Signal Analysis
- Signal Analysis Introduction
- Dialogue Window
- Sonogram Analysis
- Spectral Envelope Analysis
- Markers
- Manual Markers
- Automatic Markers
- Basic Manipulations
- Visualizing and Editing Markers Values
- Creating Sound Files from Markers
- Post-Analysis Use
- Fundamental Frequency Analysis – F0
- Voiced/Unvoiced Analysis
- Analysis Files
- Modeling Sounds with Sinusoids
- Signal Manipulation
- Managing Treatments
- Processing Sequencer
- Advanced Use
- Errors and Problems
- Basic Analysis/Synthesis Notions
