Waveform and Sonogram Windows
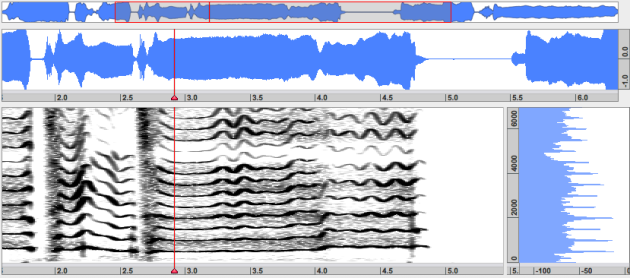
When opening a sound file, its amplitude/time waveform is automatically displayed in two waveforms : a global waveform of the whole sound sequence, and the waveform(s) of each channel – mono, stereo, multichannel.
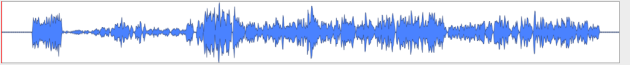
Waveform Window
The waveform window has two zones : a global and a local waveform representation
In the upper zone, the amplitude of the waveform is the sum of the amplitudes of the possible multiple channels. The sound file is represented globally.
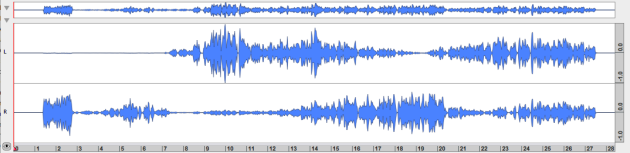
The lower zone is designed for browsing and inspecting the signal.
Each channel of the signal is represented in a specific waveform.
By default, the current segment has the same length as the whole sequence.
The lower scale expresses time in seconds. The right scale is a relative scale, which expresses the pressure variations between 1 and -1.
Within this window you can :
zoom in and out the waveform
move the waveform
browse the waveform in time and amplitude
change the time and amplitude scales units
Sonogram Window
When executing an analysis or opening an analysis file, a sonogram is displayed in the central window, with an instantaneous spectrum at the right.
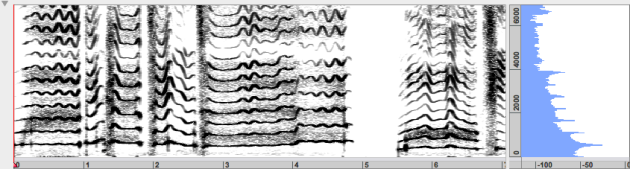
Several type of sonogram analysis can be represented in the window. These representations are frequency/time or spectral envelope representations. The amplitude of the spectral components is expressed by a white/black or colour contrast. By default, frequencies are expressed in Hz, time is expressed in seconds.
The sonogram allows to visualize the spectral composition of the signal, and how this composition evolves in time : vibratory components of the signal are represented according to their frequency, and intensity. The visual rendering of the sonogram depends on the type of analysis and parameters chosen by the user.
The sonogram representation visible length matches the temporal segment represented in the lower waveform window.
Within this window you can :
zoom in and out, move the sonogram
inspect the components of the signal
change the frequency and time scale units
modify the signal with various treatments and manipulations
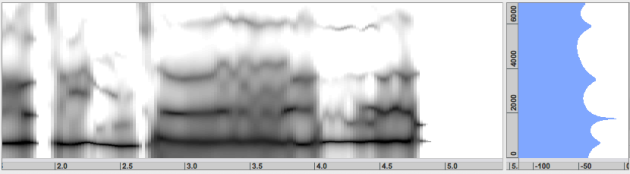
Instantanous Spectrum Window
The instantanous spectrum represents the ampitudes of the spectral components at a given time, indicated by the cursor. The frequency scale is common with the sonogram. The amplitude is expressed in dBs according to the perceived intensity, from -120 to + 6 dB.
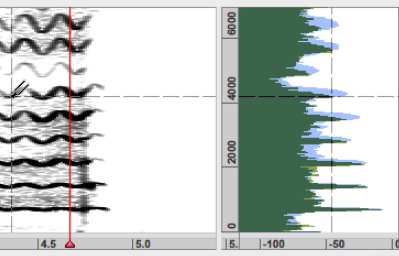 | When browsing the signal in the sonogram, the corresponding instantaneous spectrum is superimposed on the spectrum of the pointer position. |
Within this window you can :
zoom in and out, move the spectrum
browse the spectrum amplitude and frequency
change the frequency scale units
modify the signal with various treatments and manipulations
