Plot Value
Description
Plots a one curve over time from a controller dimension's value.

(plot-value ... )
Syntax and Default Values
The (plot-value) function can be created using the following Lisp syntax:
(plot-value plot_reference label controller_reference dimension)
Parameters
The (plot-value) function takes three or four arguments:
- plot_reference: reference to a plot created with (make-plot)
- label: a string (in quotes) that will be used as a label for the graph of this data
- controller_reference: a controller whose data will be plotted.
- dimension: (optional) dimension of the controller which will be plotted (defaults to 0)
You obviously do not need to provide a dimension for one-dimensional controllers. Dimensions are numbered starting from 0.
Discussion
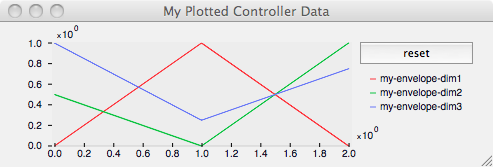
For each curve you want plotted, you call the plot-value command before running the synthesis. The first argument is a reference to a graph created with (make-plot). The second argument is a string which will be the label for that curve. The third argument is a reference to a controller whose data will be graphed. The fourth argument is optional, and can be used to specify a dimension other than the first for multi-dimensional controllers. Here is a simple example of how to plot the three dimensions of a 3-dimensional controller (the resulting graph is shown in the image, above):
(setq my-env (make-controller 'envelope 3
         '( (0 0 0.5 1)
            (1 1 0 0.25)
            (2 0 1 0.75)) ))
(setq graph (make-plot))
(plot-value graph "my-envelope-dim1" my-env 0)
(plot-value graph "my-envelope-dim2" my-env 1)
(plot-value graph "my-envelope-dim3" my-env 2)
(run 2)
(plot graph "My Plotted Controller Data")
Options
Retro-Compatibility
In very old versions of Modalys the plot feature worked slightly differently. The (plot-value ... ) function used a lambda expression instead of a controller. Older scripts will need to be updated to the new syntax.