STFT– Sonogram Analysis
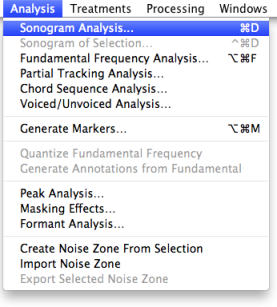
The FFT analysis method yields a sonogram, also called as spectrogram. In most cases, the FFT is refered to as a sonogram analysis, although there exist other types of sonogram analysis. This method is accessed in the AS Analysis menu.

Generalities
Early analog sonograms were applied to a wide range of sounds, such as bird calls. Digital sonograms are especially useful for studying frequency modulations in animal calls, but also to correct speech defects, in speech training for the deaf, or for the study of phonetics and speech synthesis.
In the compositional field, sonograms can be used as a medium for the manipulation of the inner structure of sounds.
Sonograms are calculated from the time signal using the short-time Fourier transform (STFT). The digital signal is broken up into chunks corresponding to an analysis window. Windows overlap, and Fourier-transformed to calculate the magnitude of the frequency spectrum for each chunk. Each chunk then corresponds to a vertical line in the image, giving a measurement of magnitude versus frequency for a specific moment in time. The spectrums are then juxtaposed to form the image.
The STFT yields a time-varying spectral representation, with two dimensions: time, on the horizontal axis, and frequency, on the vertical axis.The third dimension, that indicates the amplitude of a vibration with a particular frequency at a particular time, is represented by the darkness of each point in the image. The frequency scale can be either linear to emphasize harmonic relationships, or logarithmic to emphasize melodic relationships.

Sonograms can display all types of components of the signal – partials[1], or harmonics[2], transients[3], noise, and so on. Sonograms contain no information about the exact phase of signals : a good approximation of the original signal can be obtained, but a perfect copy of the original signal cannot be created from a spectrogram. The phase information exists in the sonogram, but it appears in another form and cannot be measured via the representation.
To execute the FFT analysis from an open sound, choose the Analysis/Sonogram Analysis and select the FFT menu item in the Analysis Type pop up menu.
Parameters and Appearance
The analysis parameters are specified in the dialogue window that opens. For detailed information, refer to the following sections.
Appearance
The appearance and accuracy of the sonogram representation can improved, or modified prior or after executing the analysis.
via the sonogram display, which allows to set the contrast of the image
via the AS preferences, where the user can choose a colour or black and white scale for the visual representation.
The time and frequency scales can be modified as well via the sonogram window.
- Partial
- Harmonic
- Transient
