Sonogram Introduction
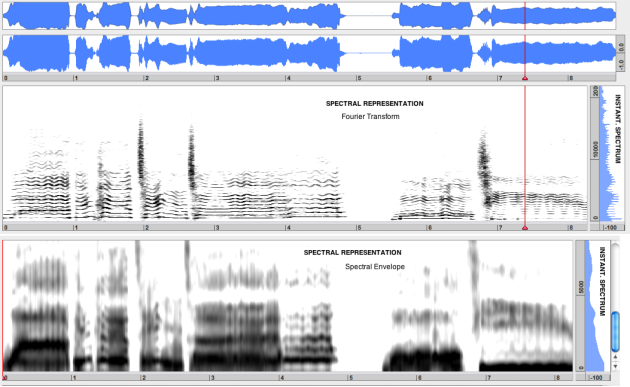
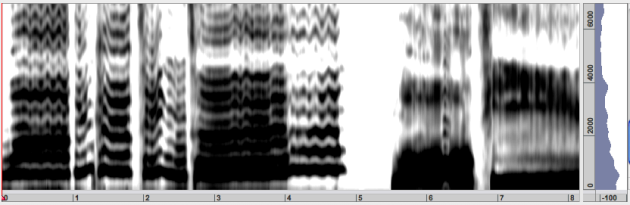
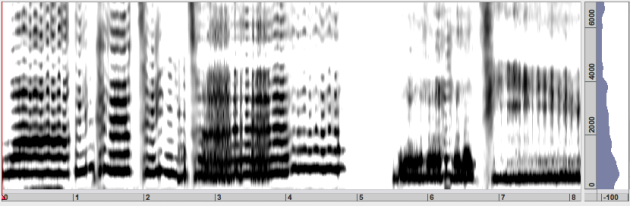
Sonograms are visual representations of the spectral contents of a sound, that is, the distribution of the signal energy over frequency, and how this energy distribution evolves in time. This section gives an overview of the various types of sonograms available in AudioSculpt 3.0.
Sonograms include two types of time/frequency representations:
representations of the temporal evolution of the frequency and amplitude of the energy of all components – sinusoids and noise[1] – of the signal
temporal representations of the spectral envelope of the signal. The spectral envelope, is a representation that characterises the spectral color of the signal. In other words it is a rough characterises the rough energy distribution negelcting detaiuls of individual sinusoidal components or noise.
The instantaneous spectrum, displayed in the adjacent window, shows the amplitude/frequency values of the the sonogram representation at a given time.
Fourier Transform Analysis
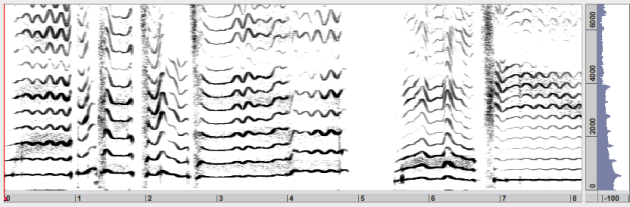
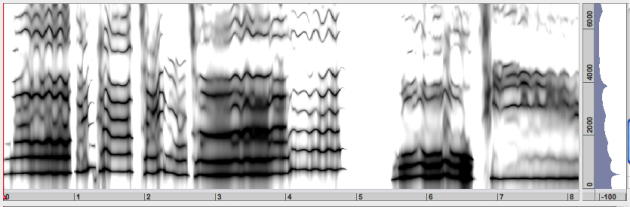
The Fast Fourier Transform decomposes the spectrum into a sum of short sections of windowed sinusoids, and represents the distribution of the energy over these components. Energy variations are represented with a contrast scale.
The energy distribution in the spectrum is also calculated with an FFT, but the energy of the individual sinusoidal components, as well as that of the transients is reassigned to increase the frequency and time resolution. The reassigned spectrogram is especially suited for precise analysis of sinusoidal components and transients.
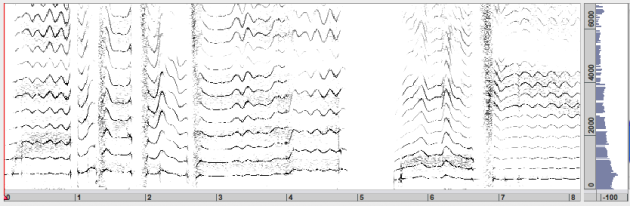
Spectral Envelope Analysis
The LPC analysis is related to a source-filter model of speech signals[2]. It estimates the filter of a surce filter model using an auto regressive filter with a filter order specified by the suer.The filter is then displayed as spectral envelope. This set of coefficients is a simplified representation of the resonator filter of the sound producing system, notably the vocal tract filter for speech. The LPC analysis has been widely used foir speech analysis but it is well know that it is well suited only for analysis of unvoiced or noise signals. for these kind of signals the LPC analysis reveles the correct filter whenever the filter order is sufficiently high. If applied to voiced signals and even if the correct filter order is specified the LPC analysis generally suffers from systematic errors and the true envelope method discussed below should be prefered.
The true envelope analysis is one of the most efficient spectral envelope estimation techniques. It is designed to improve the results of the LPC. The main adavantge is the fact that an appropriate order of the True Envelope analysis can be derived from the fundamental frequency of the sound signal. The true envelope analysis will ngelect spectral details with precision smaller then athe given max frequency. Accordingly the true envelope order is parameterized by the maximum fundamental frequency of a given sound signal. To imporve the precision it can take as input the time varying fundamental frequency of a sound signal and will then provide optimal analysis resolution.
Like the LPC or true envelope, the discrete cepstrum analysis is a method of to estimate the filter part of a source filter model. It is a precursor of the true envelope method, that is much slower and does not support the convenient order selection that is used for selecting the order of the true envelope algorithm. It remains to be present in AudioSculpt for backwards compatibility but should be replaced by the True Envelope analysis in all but those that requires to reproduce results obtained with earlier versions of AudioSculpt.
- Harmonicas and Partials
When a sound is pure, that is, non noisy, with a well defined pitch, it is said to be harmonic : the frequency if the spectral components is the produce of an integer with the fundamental frequency. We get (F0, 2F0, 3F0, ... NF0). The components can be called "harmonics".
When a sound is noisy, it is said to be inharmonic : the frequency of the components are not integer multiples of the fundamental. Components are called "partials".
- Source Filter Model of Speech
Vocal sounds are produced by an excitator, the glottis. The resulting signal has a pitch and an intensity. The resonators are the cavities of the phonation apparatus, which give rise to formants. Hisses and pops are produced by the tongue, lips and throat.
