Sampling : Signal Digitalization
Analogic to Digital Conversion : Sampling Rate
An analog signal consists on an electric signal changing during the time.
When the analog signal is converted into a digital signal, it becomes a list of numbers, or bits. The number of bits is called "encoding".
A value measuring is done at regular time intervals. Hence, a sound file has
a header, where are reported samples number, bit and sample rate a header,
a series of numbers
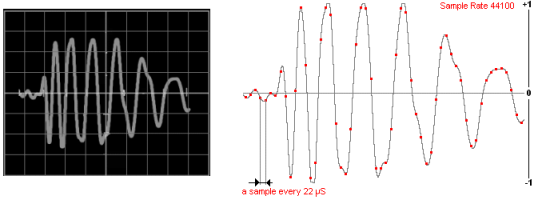
The sampling rate (SR) is the number of times a signal is read in a second (usually, 44100 or 48000 times).
As a signal is sample n times in a second, the signal is sampled every 1/n seconds
Spectrogram Frequency Range and Sampling Rate
As you noticed, a spectral representation has a precise frequency range (Fmax). The maximum frequency range is determined by the sample rate :
Fmax = SR/2
Fmax is called "Nyquist Frequency".
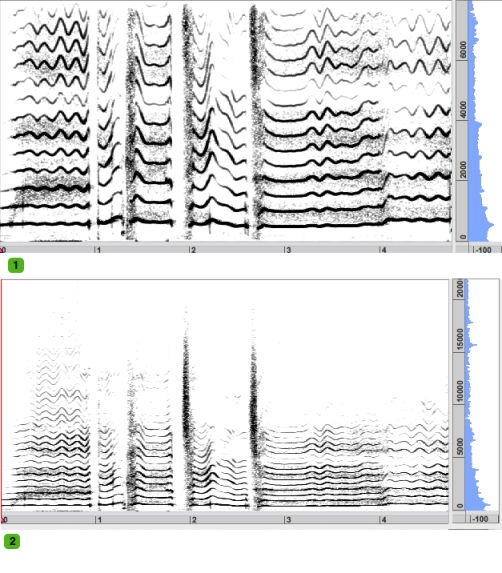
A 44100 sample rate allows to represent a frequency band from 0 to 22050 Hz, as seen in the sonogram window of AudioSculpt, for instance. Because the FFT induces a symetrical representation of the spectrum, like a mirror, the components above the Nyquist Frequency are not represented. In some cases, if the sampling rate is inferior to the requested Nyquist frequency, the components that cannot be represented are folded, causing an erroneous spectral representation : this phenomenon is called "aliasing" or spectral folding.
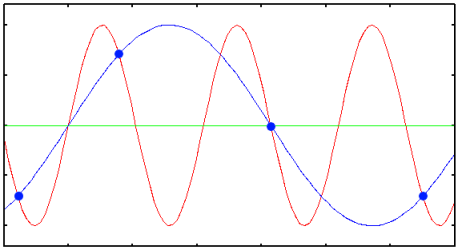 The blue dots are samples whose frequency is that of the sampling rate. The frequency isn't high enough to reconstruct the original signal, and produces a blue wrong signal. | Aliasing – from alias – is an effect that makes different signals indistinguishable when sampled. It also refers to the difference between a signal reconstructed from samples and the original continuous signal, when the resolution is too low. Basically, aliasing depends on the sampling rate and freqency content of the signal. |
The sampling rate must be equal or superior to the double of the highest frequency or the signal.
SR = Fmax * 2
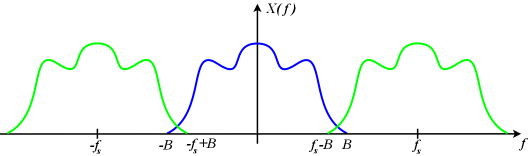
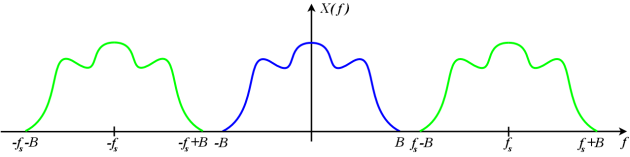
A signal is bandlimited if it contains no energy above some bandlimit B. The signal is constrained in how rapidly it changes in time. The Nyquist criterion presumes that the frequency content of the signal has an upper bound, and that the signal's duration has no upper bound. We have a mathematical model that is an approximation for real samples of a real signal.
▪ For a given highest frequency B, we get the lower bound on the sampling frequency : 2B or Nyquist rate. For instance : for a signal whose maximum frequency is 16 KHz, we need a 32 KHz sampling rate.
▪ For a given sampling rate, we get the upper bound for frequency components : B<fs/2, or Nyquist frequency or Fmax. For instance : for a signal whose sampling rate is 48 KHz, we can sample signals up to 24 KHz.
In practice, a signal can never be perfectly bandlimited. Even if an ideal reconstruction could be made, the reconstructed signal would not be exactly the original signal. The error that corresponds to the failure of bandlimitation is referred to as aliasing.
As the human ear cannot hear sounds above 22 KHz, the industry uses a 44,1 KHz sampling rate, or the 48 – professional – and 96 KHz – HD – sampling rates.
If a signal is sampled with a 32 KHz sampling rate, any frequency components above 16 KHz, the Nyquist frequency, we get an aliasing. When a signal is sampled, its contents is reduced from real numbers to integer numbers. Values can be rounded to a superior or inferior value. If some frequencies are higher than a given limit, these frequencies are "folded" below the Nyquist frequency, and adjacent copies overlap. Any frequency component above SR/2 is indistinguishable from a lower-frequency component, called an alias, associated with one of the copies.
The reconstruction of the signal creates a symetrical image. The energy above the Nyquist frequency is transfered below this frequency.
Anti-aliasing filters allow to remove components above the Nyquist frequency prior to sampling. Low-frequency aliases are still generated, but at very low amplitude levels and can be reconstructed without significant additional distortion. In the example above, an anti-aliasing filter has been used to convert the file at a new sampling rate.
