Plot
Plots a graph after synthesis of the system has been run.
(plot ... )
The (plot ... ) function can be created using the following Lisp syntax:
(plot plot_reference label type domain_min domain_max range_min range_max)
The (plot ... ) function takes a minimum of two, and up to seven arguments:
- plot_reference: reference to a plot created with (make-plot)
- label: a string (in quotes) that will be used as a label in the title-bar for this graph.
- type: (optional) a value to define the type of plot. (default 0 = plot over time)
- domain_min: (optional) minimum value for the x-axis graph.
- domain_max: (optional) maximum value for the x-axis graph.
- range_min: (optional) minimum value for the y-axis graph.
- range_max: (optional) maximum value for the y-axis graph.
The type parameter can be set to 0 to plot the specified controllers, or set to 1 to plot a 2-D x/y graph for the first two controllers.
If the x and y ranges are not given, then plot uses the minimum and maximum values of the data to automatically set the graph's domain and range.
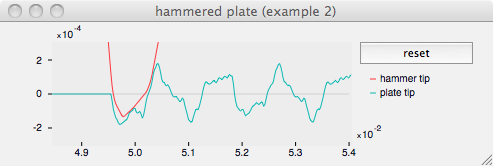
The (plot ... ) function should be called after the synthesis has been calculated using (run), naturally. By default, plot wil plot the controllers for the entire duration of the synthesis. However, by adjusting the values for minimum_x, maximum_x, etc., one can “zoom-in” on the area of interest in the plot (for example, the exact point in time when one object is supposed to be striking another). The above image shows a graph from the 'strike connection script that zooms in to the data around the 50 millisecond point.
(plot graph "hammered plate (example 2)" 0 0.0485 .0540 -.0003 .0003)
The plot command itself must be used after running the synthesis, but the other plot commands should be called before.
Naturally, you can call the plot function as often as you want; usually you are interested in a small part of the plot data, and you zoom in by calling plot with a smaller and smaller plot area. You can keep making plots until new is called. The “new” command throws out the plot data.
Options
In very old versions of Modalys the plot feature worked slightly differently. The (plot ... ) function used slightly different arguments. Older scripts will need to be updated to the new syntax.
- Modalys
- Summary
- An Introduction to Modalys
- Getting Started
- Objects
- Accesses
- Connections
- Controllers
- The Modalys Workspace
- New Workspace
- Run Synthesis
- Play Sound
- Set Message Level
- Set Precision
- Run Synthesis in Real-Time
- Listen to IP Port
- Set Angle Mode
- Get Version
- Stop
- Quit Modalys
- Point Output
- Point Input
- Save AIFF Sound File
- Save Floating-Point Sound File
- Set Sample Rate
- Set Bit Depth
- Set Number of Channels
- Get Workspace Info
- Get Angle Mode
- Make Plot
- Plot Value
- Plot
- Load Modalys Script
- Load Modalys Component
- Save Mlys Script File
- MIDI to Frequency
- Frequency to MIDI
- Finite Elements
- Appendix
- Index
