Formant Analysis
Formants Overview
Formants[1] are the result of energy peaks in a more or less narrow zone of the spectrum. In short, they can be compared with resonances. More specifically, formants deal with vocal sounds : the reinforcement of several specific frequency zones in the spectrum of vocal sounds is perceived as vowels. Although the vocal apparatus has at least five resonators, three or four of them are considered to be crucial in the production of vowels :
F1 : pharynx
F2 : oral cavity
F3 : nasal cavity (nasal vowels, in french for instance)
F4 : sinuses (singing formant)
You can get a good estimation of the central frequency and bandwidth of the formants for five vowels, via the | 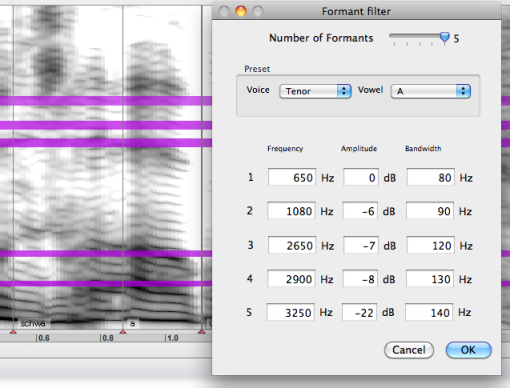 |
General Principles
The formant analysis is accessed via the Analysis/Formant Analysis menu.
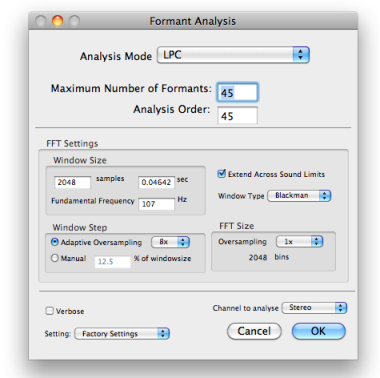
The spectral envelope is analysed to yield the frequencies of a number of formants, specified by the user.
A peak analysis is executed : depending on the parameters that were defined by the user, a number of resonators scan the spectral envelope.
The analysis is always applied to the whole sound file.
Analysis Parameters
The spectral envelope can be calculated with two methods :
LPC
Discete Cepstrum
For detailed information about the LPC and discrete cepstrum, see the corresponding section.
Number of formants yielded in the SDIF file. By defaut, the 5 main formants are analysed.
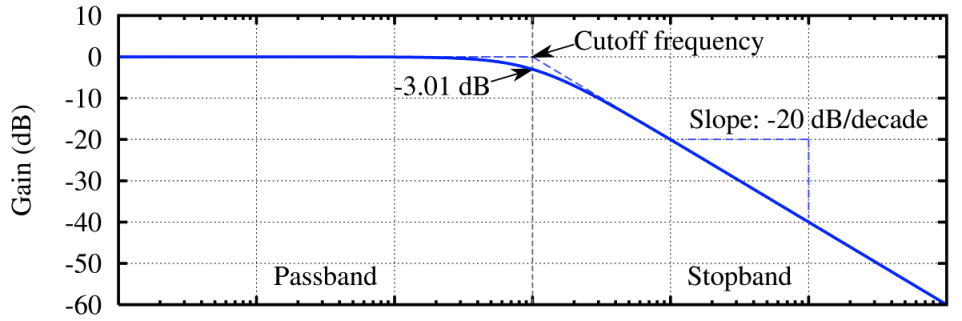
A filter has
a central frequency
a bandwidth
a stopband with an attenuation rate, or slope.
The analysis order represents the filter – or resonator – complexity. If our filter was a physical filter, this would represent the number of inductors and capacitors, which emphasize or filter the spectral components.
The filter's response is optimal with little energy for a given frequency, within a given passband. Once the limit of the passband is reached, its response decreases more or less progressively for neighbour partials : this characterizes the slope.
The slope's steefness depends on the filter's complexity. The more complex the filter, the steefest is the slope of the passband : the higher the attenuation rate is, as the frequency decreases.
This rate can be calculated as follows. For n poles, we have
–6n dB/octave
–20n dB/decade
An octave is a doubling or halving of the frequency; a decade is a tenfold increase or decrease of frequency.
An LPC analysis requires at least two poles per formant.
Example : Envelope of a Spoken Extract and Formant Analysis
We have analysed a short extract of a Rilke's poem. The LPC shows the various zones of energy reinforcement in the spectrum. Especially, some zones show important transitions between two vowels (at the end a closed and an open e/ɛ for instance).
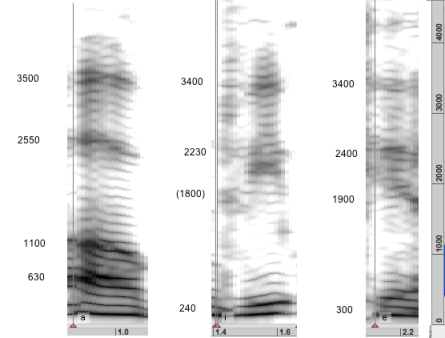
We want to get the 5 first formants of the spectrum. We have tried several number of poles, from 20 to 60. If we convert the SDIF file into a text file with SDIF Converter, considering only the time, frequency and amplitude, the values for each formant will be displayed one after the other for a given point in time.
Here is an example of the data we get with 60 poles at three different locations of the file :
Time (vowel a) | Frequency | Time (vowel i) | Frequency | Time (vowel e - closed) | Frequency |
|---|---|---|---|---|---|
0.23 | 630 | 1.57 | 238 | 2.17 | 1958 |
0.23 | 1109 | 1.57 | 2238 | 2.17 | 2417 |
0.23 | 2532 | 1.57 | 3393 | 2.17 | 3355 |
0.23 | 3481 | 1.57 | 6013 | 2.17 | 4253 |
0.23 | 6012 | 1.57 | 6621 | 2.17 | 4771 |
The values match a visual estimation of the formants quite precisely. They are quite close to those of a tenor voice, but this is only an indication. Note that the first formant of the e and the second formant of the i are missing.
To get a good estimation of the formants of the voice, use the fry
- Formant
Formants were originally defined as spectral peaks in a sound spectrum. Resonance and formant are conceptually distinct, but some writers about the voice use the terms interchangeably. Second, the acoustics of the vocal tract are often modelled using a mathematical model of a filter, where the frequencies of the poles of this model fall close to those of the formants. As a result, some voice researchers now refer to the frequencies of the poles as formants.
Hence, it can be : a peak in the spectrum, a resonance of the vocal tract, or a pole in a mathematical filter model.
In acoustics a formant is originally a broad peak in the spectral envelope of the sound. The singers formant and actors formant are broad peaks in the spectral envelope occurring around 3 kHz. In vocal sounds, formants result into vowels.
