Peak Analysis
General Principles
At each FFT frame, amplitude maxima are detected in the short terme amplitude spectrum.
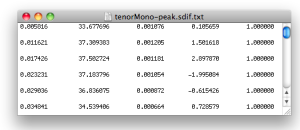
The resulting sdif file contains 1PIC frames. These frames are a standard type of sdif matrix dedicated to sinusoidal modeling. The data correspond to a constant sinusoid producing a peak in the frequency estimate. Information is displayed in several rows.The matrix contains information about the
|
Basic Procedure
You can possibly select the region you want to analyse, with a click and drag.
Choose
Analysis/Peak Analysis.In the dialogue window, specify the analysis parameters.
Press
OK
In the dialogue window, specifiy a name and location for the file.
Threshold in dB : minimum amplitude difference between peaks and neighbour minimum values. By default, the threshold is set to -95 dB – the audibility threshold is equal to -120 dB –. A 0 dB threshold amounts to detecting all peaks.
Maximum Number of Peaks : an n number of peaks to detect in each analysis window. By default, 3 peaks are detected in each analysis window.

