Browsing the Waveform and the Sonogram
Waveform
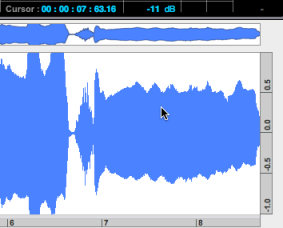
When hovering the cursor over the local waveform representation, the temporal position and corresponding amplitude in dB are displayed in the lower part of the transport window.

Sonogram and Instantaneous Spectrum
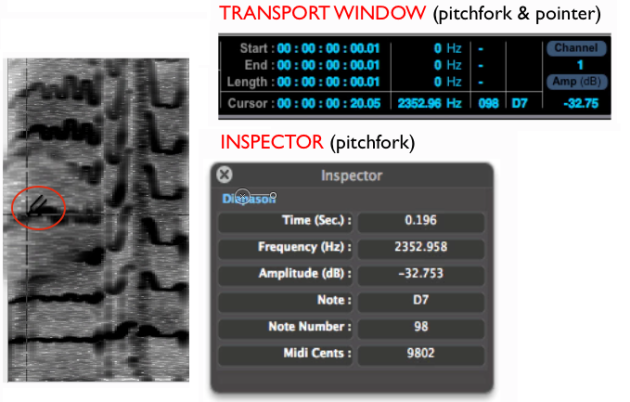
To get information about the temporal position in seconds, amplitude in dB, frequency in Hz of a spectral component :
hover the arrow
 over the sonagram : information is displayed in the Transport Window, at the top of the sonogram window.
 use the pitchfork
 tool, to listen to these components with a click. In this case, this information is displayed in the Inspector Window.
The corresponding note and midi pitch are displayed in the Transport and Inspector Windows.
The amplitude is expressed in dBs according to the perceived intensity, from -120 to + 6 dB.

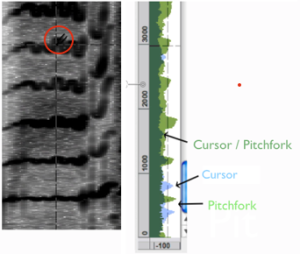
When browsing the sonogram with the pitchfork, we get a representation of
|
The instantaneous spectrum can also be browsed precisely with the pitchfork ![]() tool, via the sonagram or not.
tool, via the sonagram or not.
The same information – temporal position in seconds, amplitude in dB, frequency in Hz – is displayed in the Inspector and Transport window.
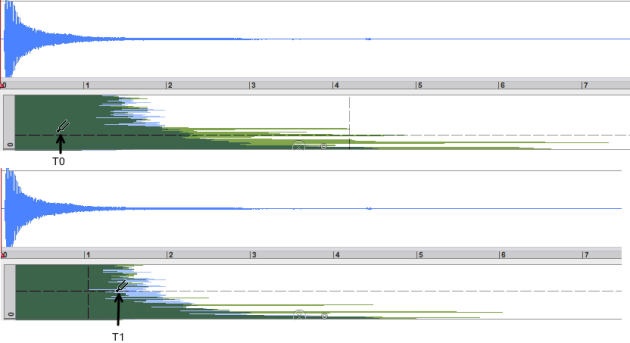
Using the pitchfork allows to compare the current amplitude envelope – green – with that of the player position – blue –. You can drag the Instantaneous spectrum window to its maximum so that it fits the waveform window.


