Zooming In and Out the Representations
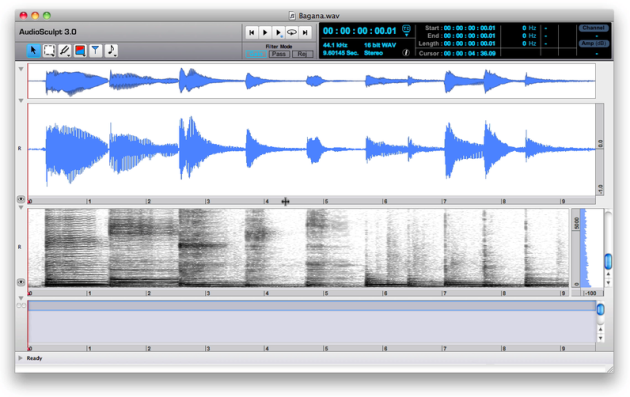
The signal representations – sonogram, waveform and instantaneous spectrum – can be studied in time, frequency and amplitude domains. Most manipulations described in this section are common to the three representations. The representations can be browsed and zoomed in or out.
Additionnaly to "manual" operations, the Windows menu gives access to most operations described in this section. Besides, a single procedure can apply to different parameters : zooming in a frequency or amplitude zone is done the same way, for instance.
Temporal Zoom
 | To zoom around the cursor position, use the To zoom around the pointer position
|
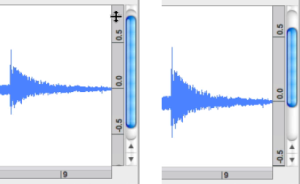
Shift click and drag the mouse over a portion of one of the scales. The selection will turn grey.
To increase or descrease the size of the segment – zoom out or zoom in – leftwards or righwards, click and drag one of the borders of the red rectangle
 .
.To reset the general view double click on one of the scales.
To move the selected segment :
click on one of the scales to display the double arrow
 and drag the mouse leftwards or rightwards.
Shiftclick in the rectangle to display a triangular pointer and drag the mouse leftwards or rightwards.
To move the temporal segment and zoom in or out simultaneously : rotate the mouse.
Amplitude or Frequency Zoom
These manipulations are the same as the previous ones, with a few differences.
|
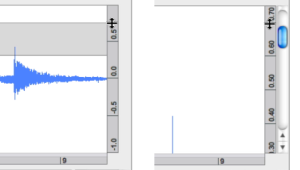
To increase the speed of the zoom, keep pressing on the amplitude scale.
If you click in the upper part of the scale, the waveform will move upwards, towards the negative amplitude values.
If you click in the lower part of the scale, the waveform will move upwards, towards the positive amplitude values.
Alt click to zoom out.

Zooming In or Out a Region/Full Scale
Temporal Location
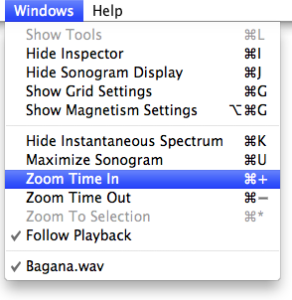
Use the Window/Zoom Time In-Out or the corresponding Cmd + = or - shortcut.
Click somewhere on one of the temporal scale and scroll the mouse up or down to zoom in or out.
Click somewhere in one of the scales to display a vertical double arrow
 and keep pressing to zoom in.
 Altclick to zoom out.
Temporal Selection
Shift click and drag the mouse over a portion of one of the scales. The selection will turn grey.
To increase or descrease the size of the segment – zoom out or zoom in – leftwards or righwards, click and drag one of its borders ![]() .
.
To reset the general view double click on one of the scales.
To move the selected segment :
click on one of the scales to display the double arrow
 and drag the mouse leftwards or rightwards.
Shiftclick in the rectangle to display a triangular pointer and drag the mouse leftwards or rightwards.
To move the temporal segment and zoom in or out simultaneously : rotate the mouse.
Instantaneous Spectrum
All the manipulations described here apply to the instantaneous spectrum as well.
A sonogram analysis must have been executed in order to display the instantaneous spectrum.
The instantaneous spectrum can be manipulated independently from the other representations in the amplitude domain.
All manipulations related to the frequency domain will also affect the sonogram.
Examples
Frequency Zoom
The default scale of the sonogram goes from 0 to 7KHz. It can reach half the value of the sampling rate, or Nyquist frequency – 22.05 KHz for 44.1 KHz for instance.
The default value of amplitude "positive" or "negative" peaks is equal to 0 dB, and the default value of the rest position – central axis – is equal to -60 dB. In the waveform representation zone, peaks are equal to +1 or -1. The rest position is equal to 0.
|
To increase the speed of the zoom, keep pressing on the amplitude scale.
If you click in the upper part of the scale, the waveform will move upwards, towards the negative amplitude values.
If you click in the lower part of the sclae, the waveform will move upwards, towards the positive amplitude values.
Alt click to zoom out.
Zooming In or Out a Region
To zoom in a precise region from the values of the scale, |
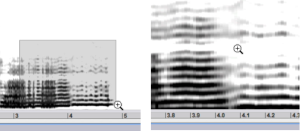
To zoom directly in a time/frequency or time/amplitude region,
select the zoom tool in the palette – press
Sclick and drag a region in the waveform or in the sonogram.
Press Alt and click to zoom out, or double click to reset the representation to the maximum range of the scale.
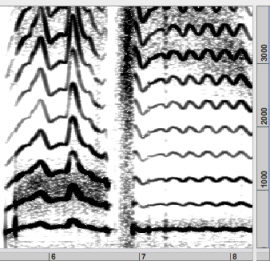
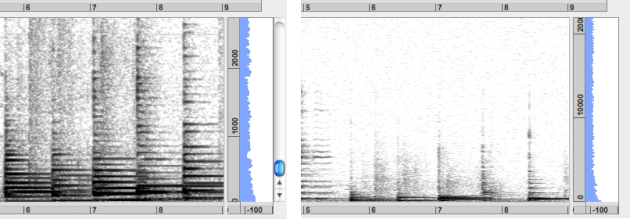
To get a general view of the whole waveform or scale, double click on a scale.


