Window Size
The window size represents a number of samples, and a duration. It is the main parameter of the analysis. The window size depends on the fundamental frequency, intensity and changes of the signal. The FFT size is a consequence of the principles of the Fourier series : it expresses in how many frequency bands the analysis window will be cut to set the frequency resolution of the window. The window size influences the temporal or frequency resolution of the analysis.
Reminder : Period and Frequency
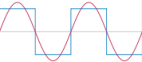 Two periods in a periodic signal. | The FFT is based on a supposed periodicity[1] of sounds. The period (T) is the duration of a cycle, in s. The frequency (F) is the number period per second. It basically determines the pitch of a sound. T = 1/F F = 1/T For instance, an A4 has a 440 Hz. T(A4) = 1/440 ≃ 0,0023 s. F(A4) = 1/0,0023 ≃ 440 Hz. The lower a sound, the lower its frequency, the longer its period is. |
Window Size Parameters
A window size is expressed in samples. This parameter is a variable. But we also have a fixed parameters, which is the sampling rate (44100 or 48000 samples per second, for instance). From this, we can calculate the other parameters of the window, such as its duration of frequency resolution.
The relationship between the number of samples of the window and its duration of the window ) We know that the sampling rate (SR) of the sound corresponds to 1 second, and that the period is inverse to the frequency.
T = Window Size/SR.
With a 1024 samples analysis window and a 441000 sampling rate, we have :
The duration of the window must be five time longer than the period of the signal, that is :
T(Window) = 5* T(Signal).
For instance, the window size for a 440 Hz signal should be :
5*(1/440) : 0,025
Each strip of the analysis will represent an image of the spectrum which will be worth 25 ms.
The choice of the window size must be done considering the frequency of the signal. If these factors evolve, this must be taken into account. The lowest detectable frequency (F0) is determined by the size – duration – of the window.
F0 = 5*(SR/Window Size)
For instance, with a 1024 samples analysis window, we have :
F0 = 5*(44100/1024) ≃ 215 Hz.
From there, the window size should be :
WS = 5*SR/F(Signal)
For a 440 Hz signal, we get WS = 501
For a 100 Hz signal, we get WS = 2205
The lower the pitch, the bigger the window size should be.
Window Size and Temporal Resolution of the Analysis
The duration of the analysis window, or time resolution, is inversely proportionate to the frequency resolution.
A sampling rate corresponds to a 1 second duration. The analysis window duration is :
TR = Window Size/SR
The longer the window, the less "images" we get of the signal evolution in time.
With the same 44100 sampling rate and 1024 points FFT , we get
T = 1024/44100= 0.023
The spectrum is equally split into images representing a 23 ms. duration.
If we choose a 4096 FFT, we get
FR = 4096/44100 = 0,093
The spectrum is equally split into images representing a 93 ms. duration. The frequency resolution is less precise.
Window Size and Frequency Resolution of the Analysis
This frequency resolution is determined by the number of "bins" in the analysis window. The number of bins actually is the FFT size, another parameters that will be discussed more specifically in the next section. For the time being, you just need to focus on the notion of "bins".
The number of samples of a window is divided into a number of "horizontal" strips, or bins. The number of bins determins the frequency resolution of the analysis, that is, how accurate the analysis can be in terms of frequency detection.
N (Bins) = Window Size/2
This number of bins must be a power of 2 starting from 512 : 512, 1024, 2048, 4096...
Note that the window size is generally also defined as a power of two, but this is not compulsary. This means that the number of bins is generally equal to the window size.
For instance, a 1024 samples window has 512 bins.
The frequency resolution (FR) is the frequency band of a bin. Remember : for a given sample rate, we have a corresponding frequency range Fmax, or NyQUist frequency. We have two ways to know the frequency resolution :
Fmax is split into a number of bins.
The sample rate is split into the number of samples in a window.
When the number of bins in a window is equaly to the window size, the frequency band of a bin is the same as the frequency band of the window.
FR = Fmax/N(Bins) = SR/Window Size
The more bins, the more slices of frequency range we get, and the more precise these slices are.
The frequency resolution (FR) is the frequency band of a bin.
For a given sample rate, the corresponding frequency range of the representation is split into a number of bins.`
FR = Fmax/N(Bins)
This also means that the sample rate is split into the number of samples in a window :
FR = SR/Window Size
The more bins, the more slices of frequency range we get, and the more precise these slices are.
Let's take a 44100 sampling rate. SR=44100 Hz, F(max) = 22050 Hz.
With a 1024 window size (512 bins), we get .
FR = 44100/1024 = 43.066
FR = 22050/512 = 43.066
The spectrum is equally split into 512 bins of 43.066 Hz width.
If we choose a 4096 window size with 2048 bins, we get
FR = 44100/4096 = 10, 76
FR = 22050/2048 = 10,76
The spectrum is equally split into 2048 bins of 10.76 Hz width. The frequency resolution is more precise.
Maximum Frequency Resolution
The number of bins in the window shouldn't be superior to 16 384 in order to display the sonogram, which corresponds to a 1.35 Hz frequency resolution – which is very high. Otherwise, the analysis cannot be displayed, but its can be saved as an SDIF file.
- Periodicity
Periodicity is the fact, for a phenomenon, of reproducing itself identically to itself over a given laps of time. Each reproduction of the phenomenon is a cycle. With a sound wave, this phenomenon is an oscillation. The amplitude of the wave goes from a rest position to a peak of compression, to the rest position again, to a peak of rarefaction, and to a rest position.
