Psychoacoustic Overview
Auditory System and Perception
Due to their physiology, the outer, middle and inner ear don't respond linearly to pressure waves depending on their incidence, frequency or amplitude. This behaviour can be designed to ease sound sources detection, localisation, or protect the auditory system. More generally, this affects pitch, intensity and timbre perception, which is not linear.
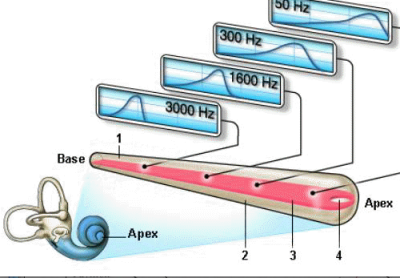 | When a sound wave reaches the inner ear, the wave travels along the basilar membrane. Depending on the wave length and varying steefness of the membrane, low frequencies travel further than high frequencies along the membrane. For a characteristic frequency, the membrane, the Corti cells and nervous fibres on the membrane have an optimal response, at a precise location. The membrane moves with a maximum amplitude, the cells amplify this movements with a maximum efficacity, and neurotransmitters as well as nervous impulses are released even with very a tiny stimulus. This response can also exist at lower frequencies, but a much higher amount of pressure is necessary. Consequently, the basilar membrane is said to be ‘sharply tuned'. This relationship between the frequency and location on the membrane is called the cochlear tonotopy. Our auditory system is able to detect the frequency of a pressure wave via the location of the maximum amplitude caused by the wave on the membrane. |
When a cell is excited by the pressure wave, it releases neurotransmitters at the same frequency as that of the wave. Consequently, we can also code the pitch temporally, and not only from the location of the excited cells. This is the case for instance when we perceive the pitch of a fundamental from the frequency of the upper harmonics of a sound, even if no energy is found in the actual fundamental of a sound. This is a subjective, or virtual perception of pitch.
This means that the pitch is detected with two different mechanisms : tonotopic and temporal coding. The coexistence of these mechanisms is especially noticeable when listening to sounds with very low and/or weak fundamental frequencies, with resonances within the dominant audible area. The ear is not very with sensitive below 200 Hz, the ear is less sensitive, and we have trouble perceiving pitches below 30 Hz. Our ear is very sensitive to frequencies between 300 and 8000 Hz. We can detect this fundamental frequency, but we can also focus on the pitch of these higher resonances. This is the case with diphonic chant for instance, or with the extreme register of low instruments, for which the ear is not very sensitive, or cannot even detect a clear tone – below 30 Hz.
Critical Bandwidth and Masking Effect
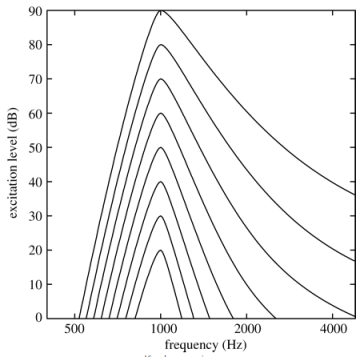
The tuning of the basilar membraneis also called auditory filtering, or critical bandwidth. Each critical bandwidth has a frequency resolution. This resolution determines the ability to choose a filter which is centered over the expected frequency of the signal, but no other frequency.
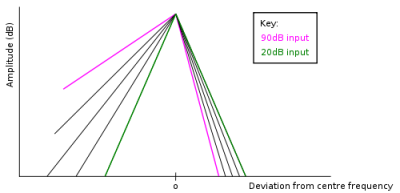 Model of an auditory filter. Effect of the amplitude over the asymetry. | The bandwidth of the filter increases with the frequency. The asymmetry of the filter increases with the input level. Consequently, low frequencies mask high frequencies better than the reverse. |
If a signal is masked by a different frequency, this means the auditory system can't distinguish between the two frequencies. This is the case when two frequencies are similar, or quite close, when we listen to a voice withing the background noise of the street... Experimentations about masking conditions allow to determine the frequency selectivity of the auditory system.
The greatest masking is when the masker and the signal are in the same auditory filter, that is, have the same frequency.
When two frequencies are quite close, a frequency can mask neighbour frequencies, if its amplitude is higher. The masking is especially significant when a low frequency is used to mask a higher frequency. The effect grows with the amplitude of the signal.
Our auditory system is able to attenuate the amplitude of low frequencies, to restrict the impact of this masking. The auditory filter can also reduce the effects of a masker when listening to a signal in background noise using off-frequency listening. If the listener uses a different filter that also contains part of the signal and less masker, say, in a close frequency range, the signal can be detected again. On the left, the auditory filter is centered on the signal and some of the masker falls within that filter. The signal to noise ratio is low. On the right, the auditory filter is not centered on the signal, but some of the signal is included in the filter, and less masker is included in the filter. Then the signal-noise-ratio is increased, and the masking effect if reduced. | 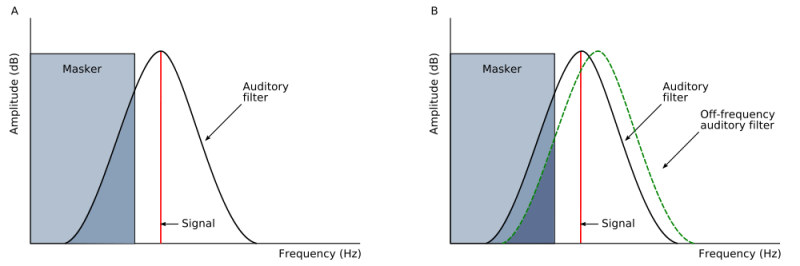 |
Masking Effect Analysis
The Terhardt's virtual pitch algorithm is designed to recalculate the amplitude spectrum integrating the processing of spectral pitch by the brain, and includes a number of psychoacoustic effects, among which sensibility threshold variations, multiple complex tones that which evoke several pitches, and masking effects.
The Fourier analysis of a signal yields approximation patterns of frequencies and amplitudes. The algorithm translates these patterns into spectral-virtual-pitch patterns according to
hearing threshold
masking effects
components interaction in subjective pitch
components relative weight and frequency
formation of virtual pitches by subharmonic coincidence.
Source : http://www.uni-graz.at/richard.parncutt/ptp2svpDoc.html
You can possibly select the region you want to analyse, with a click and drag.
Choose
Analysis/Masking Effect.In the dialogue window, specify the analysis parameters.
Press
OK
In the dialogue window, specifiy a name and location for the file.
Maximum Number of Peaks : maximum number of peaks in the output. The peaks selected are the peaks with the largest amplitude.
Threshold : attenuation below the peak amplitude. A peak is taken if its maximum is at least equal to this threshold above the neighboring minima.
For instance, if the number of peaks is 20, with a 30 dB threshold, the 20 strongest peaks with an amplitude larger than 30dB above the two neighboring minima will be detected.
SDIF File Content
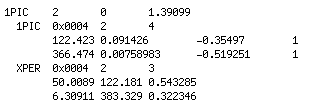 | The whole content of the file can be converted into a text file via SDIFToText. It contains 1 PIC frames and XPER matrices, with perceptual data :
|
