Basic Manipulations
Appearance
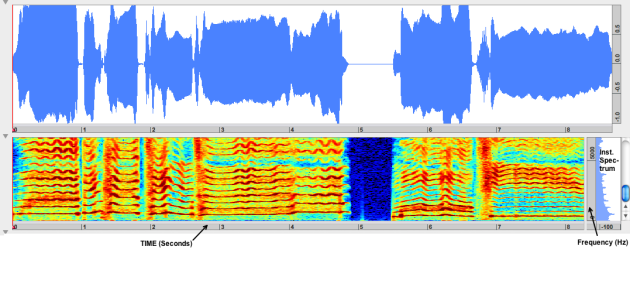
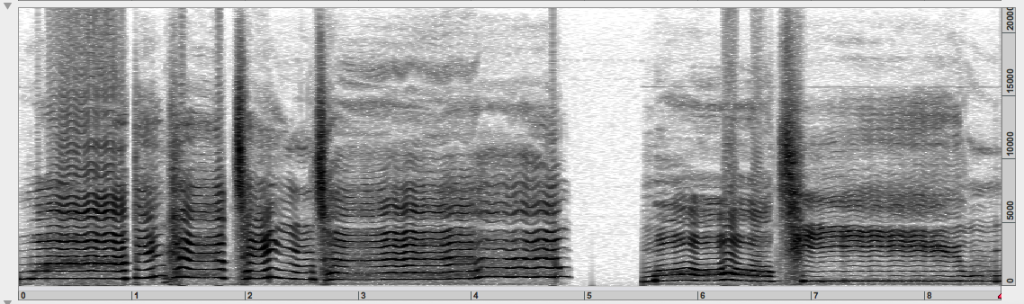
The sonogram representation is displayed below the waveform of the signal on a hot-cold mode.
The bottom axis expresses time in seconds. The right axis expresses frequencies in Hz.
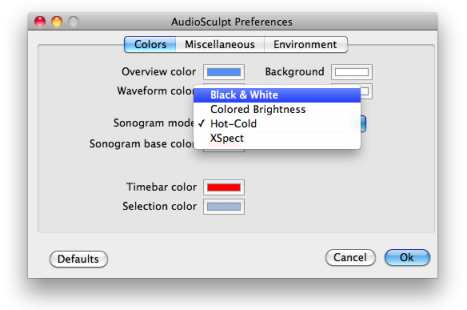 | To get a clearer representation, select |
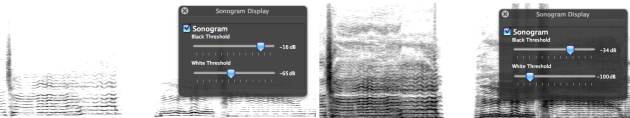
You may need to modify the contrast of the image, to highlight spectral components, for instance. To do so, use the black and white threshold cursors of the Sonogram Display.
These thresholds represent dB – intensity – values from -120 to 0 dB,0 dB being a maximum intensity. Components whose intensity is comprised between the white and black threshold are represented. Modifying these thresholds necessarily affects the image contrast. It will not affect the signal.
To modify the size of the sonogram zone, click and drag the corresponding axis. Note that this won't affect the scale of the sonogram, but its proportions.
To zoom in or out the whole sonogram, select Windows/Zoom Time In-Out or press Cmd
= or -.
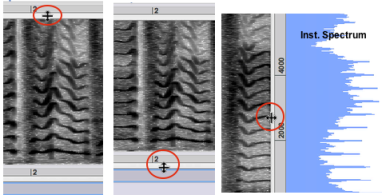
To browse the sonogram in a given frequency or time area, click and drag the mouse on the frequency or time axis, at the desired frequency or temporal position.
To set the frequency scale to its maximum – 22 KHZ –, double click on the frequency axis. To represent the whole sequence, double click on the time axis. You will get a global view of the sonogram.
It may be necessary to hide the instantaneous spectrum to display the integrality of the sonogram. To do so, select Windows/Hide Instantaneous Spectrum or press Cmd + K.

Size, Scale and Frequency Limits
To modify the size of the sonogram zone, click and drag the corresponding axis. Note that this won't affect the scale of the sonogram, but its proportions.
To zoom in or out the whole sonogram, select Windows/Zoom Time In-Out or press Cmd
= or -.
To browse the sonogram in a given frequency or time area, click and drag the mouse on the frequency or time axis, at the desired frequency or temporal position.
To set the frequency scale to its maximum – 22 KHZ –, double click on the frequency axis. To represent the whole sequence, double click on the time axis. You will get a global view of the sonogram.
It may be necessary to hide the instantaneous spectrum to display the integrality of the sonogram. To do so, select Windows/Hide Instantaneous Spectrum or press Cmd + K.
