- Zoom
Representation Units
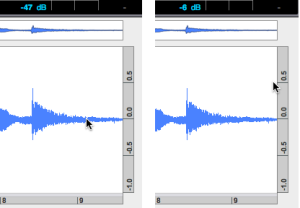
Amplitude Scales
 | As displayed with a
This scale cannot be modified. |
Consequently
|
"In digital audio a convenient choice of reference, assuming the hardware has a maximum amplitude of one, is a0 = 10−5 = 0.00001. The maximum amplitude possible is 100 dB, and 0 dB is likely to be inaudibly quiet at any reasonable listening level. Conveniently enough, the dynamic range of human hearing — the ratio between a damagingly loud sound and an inaudibly quiet one — is about 100 dB."
Source : M. Puckette – The Theory and Technique of Electronic Music
 | A The sonagram represents the sinusoids used for the signal resynthesis. The sinusoids amplitude varies between positive and negative values, but as these oscillations cannot be heard, they are not represented. The perceived amplitude is always positive. The logarithmic scale is used for measures where values close to 0 don't need to be taken into account, and hence don't need to be represented. It also allows to represent low amplitudes of high frequencies, and high amplitudes of low frequencies, which are equally perceived. This scale cannot be modified. |
Frequency Scales
In the sonogram and instanteneous spectrum, frequencies are expressed
in Hz or KHz (1000 Hz = 1 KHz)
with a linear or logaritmic scale.
In a linear scale, the space between two values has a linear relationship with the difference in Hz. In a logaritmic scale, the visual space reflects the human perception of pitch and intervals.
To select a scale, Ctrl click on the axis and choose an item.

Time Scale
 | By default, time is expressed in seconds. It can also be expressed in milliseconds, seconds, ticks, samples, or durations. One second is equal to 60 ticks. To choose another unit, |
Note that this modification will apply to all the windows of the interface.
- Audio Clipping
Clipping is a form of waveform distortion that occurs when an amplifier is overdriven. The signal is amplified at which point the signal simply "cuts" or "clips" at the maximum capacity of the amplifier. The extra signal is simply cut off, resulting in a sine wave becoming a distorted square-wave-type waveform
In digital signal processing, the signal is restricted by the range of a chosen representation. For example, in a 16-bit system, 32767 is the largest positive value that can be represented. If the amplitude of the signal is doubled, sample values of, for instance, 32000 should become 64000, but instead they are truncated to the maximum, 32767.
Source : http://en.wikipedia.org/wiki/Clipping_(audio)
- Representation Units

