Make Plot
Initialize a graph for plotting data obtained from a controller.
(make-plot)
The (make-plot) function can be created using the following Lisp syntax:
(make-plot)
This command initializes a graph, and returns a reference to it. It has no additional parameters.
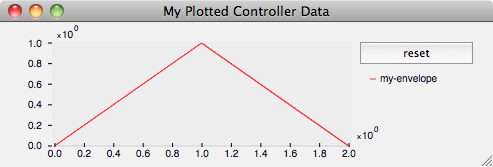
You should use (make-plot) before calling any of the other plotting functions, since they need the reference to the graph it creates. Here is a simple example of how to use this plotting feature (the resulting graph is shown, above):
(setq my-env (make-controller 'envelope 1 '((0 0) (1 1) (2 0))))
(setq graph (make-plot))
(plot-value graph "my-envelope" my-env)
(run 2)
(plot graph "My Plotted Controller Data")
Naturally, the (new) command deletes all plots when it clears the workspace.
Options
In very old versions of Modalys, the plot feature worked slightly differently. Older scripts may need to be updated to the new syntax.
- Modalys
- Summary
- An Introduction to Modalys
- Getting Started
- Objects
- Accesses
- Connections
- Controllers
- The Modalys Workspace
- New Workspace
- Run Synthesis
- Play Sound
- Set Message Level
- Set Precision
- Run Synthesis in Real-Time
- Listen to IP Port
- Set Angle Mode
- Get Version
- Stop
- Quit Modalys
- Point Output
- Point Input
- Save AIFF Sound File
- Save Floating-Point Sound File
- Set Sample Rate
- Set Bit Depth
- Set Number of Channels
- Get Workspace Info
- Get Angle Mode
- Make Plot
- Plot Value
- Plot
- Load Modalys Script
- Load Modalys Component
- Save Mlys Script File
- MIDI to Frequency
- Frequency to MIDI
- Finite Elements
- Appendix
- Index
