Sonogram and Instantaneous Spectrum Windows
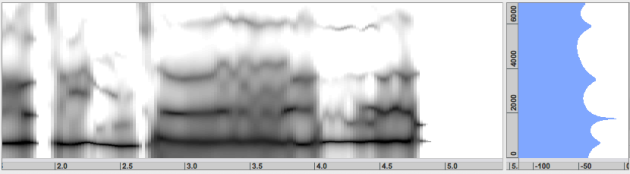
The sonogram is displayed in the central window, with an instantaneous spectrum at the right. The type of sonogram can be chosen by the user in the Sonogram Analysis dialogue window. The analysis applies to each channel of the sound file.
Sonogram Window
Frequencies are expressed in the vertical scale, on the right. By default, frequencies are expressed in Hz.
Time is expressed in the horizontal scale, by default in seconds.
The amplitude of the spectrum is expressed by means of a white/black or colour contrast. This contrast can be set manually via the Sonogram Display.
Several tools allow to browse the contents of the sonogram and get information about the frequency, amplitude and temporal position of its components : the pointer, and the pitchfork tool.
Instantaneous Spectrum
The instantanous spectrum represents the ampitude of the spectral components at the cursor position when playing, or a the pointer position. The vertical scale expresses frequencies in Hz or KHz. The horizontal scale expresses perceived amplitudes in dBs from -120 to + 6 dB.
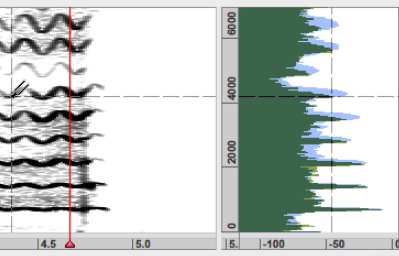 | When browsing the signal in the sonogram, the corresponding instantaneous spectrum is superimposed on the spectrum of the player position. |
